This manual will run you through some scenarios which explain the basics of the GUI.
VINeM is provided as an executable jar file, therefore, it can be run without an installation on any computer that has a Java Runtime Environment. Similarly, removing the files is enough for uninstalling. Do not forget to clean the recent files list before deleting the application.
In most operating systems you can use right-click menu on the jar file menu to run the application. Or, you can give the following command on the console:
java -jar vinem.jar
Performance can be improved by allocating more memory. The following command gives 1 gigabyte of memory:
java -jar -Xmx1g vinem.jar
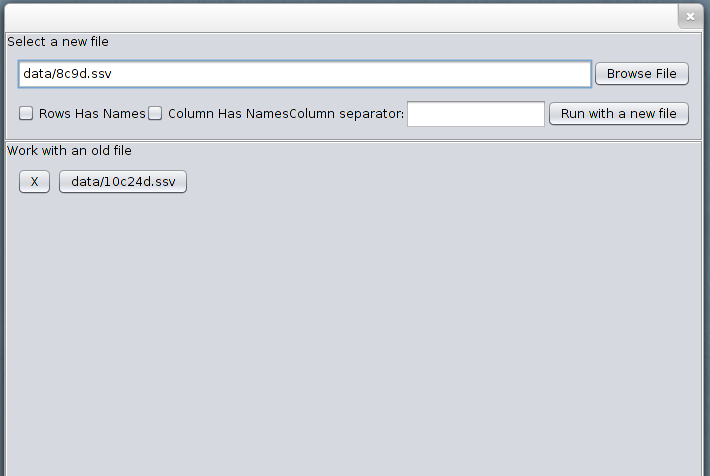
Program starts with a file selector. To investigate a new file, enter the path to the file, either by using the respective input field or the Browse File button.
Data should be in a delimited format, satisfying the following properties: - each row represents an instance, except the header row if present, - each column represents a feature, except the header column if present, - all instances have the same number of features, - there are no missing values, - real values should be in the USA locale (use . as decimal separator)
If the rows have names, i.e. the first column contains the names of the objects, or the columns have names, i.e. the first row contains the names of the attributes, then select the respective checkboxes. Enter the delimiter to the delimiter field and click the button Run with a new file to start the analysis.
A history of files is provided as well. You can click on a button with the name of a file to re-open it. To remove a file from the history click X button next to the file name.
After the selection of the file, two main panels of VINeM are shown:
1. Visualisation of the neighborhoods as a Neighborhood Matrix. Each column represents an object while each row represents the neighborhood of an object.
2. Control panel.

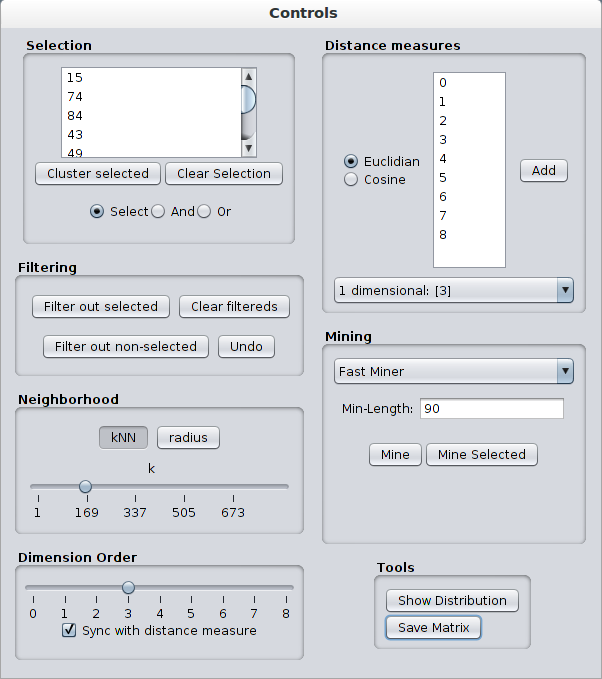
By default, kNNs of each individual dimension are shown as neighborhoods.
Neighborhood parameters can be updated using the Neighborhood panel. k-Nearest-Neighborhood and radius-based neighborhood are supported. Sliders can be used to update the neighborhood size k or the neighborhood radius eps. Hovering over these sliders shows a tool tip containing their actual value. These sliders can also be incremented/decremented by one using the mouse scroll wheel.
Dimension Order affects the order of the objects in the visualisation panel. Both the rows and columns are sorted according to the selected attribute. For convenience, the objects are sorted according to the projected dimension that is being shown.
On the other hand, order of a neighborhood matrix does not have to be same with the order in the projected neighborhood. For example, neighborhood matrix of attribute 1 can be sorted according to the values in the attribute 2. To break the sync between the order and the distance measure, clear the checkbox Sync with distance measure.
Selected objects are colored green in the Neighborhood Matrix. Selecting objects can be done in a couple of ways:
Using the Neighborhood Matrix: You can press down the left mouse button, drag over an area and release. This will trigger a selection. Depending on the state of the radio buttons at the bottom of the Selection part of the control panel this will either select the area (Select), intersect the previous selection with the area (And), or add the area to the previous selection (Or).
By using the list of object names in the Selection part of the control panel. This list is ordered according to the order slider and it is in sync with the selection in the visualisation panel, so any objects selected in this list are also selected in the visualisation panel. It supports standard list selection controls, e.g. ctrl+clicking an id will add/remove it to/from the current selection.
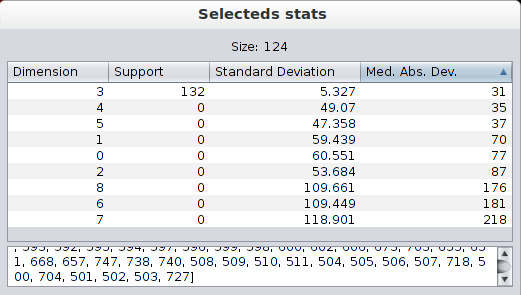
Once a selection has been made, a dialog is shown containing some information about the selected objects. The size of the selection is shown at the top and the names of the selected objects are shown at the bottom. In the middle, there is a table containing three statistics of the selected objects in each dimension:
You can create a cluster containing the selected objects by using the Cluster selected button in the Selection panel. Clusters can be created in other ways, such as mining which is explained in its own section.
If there are any identified clusters, information about the cluster(s) are shown in Clusters Info dialog. The first column contains a checkbox which determines whether to visualise the cluster in Neighborhood Matrix, visible clusters are colored red. The other columns give information about the clusters:

You can also do some fine-tuning by first selecting the cluster(s) you want to change. Normal list selection controls apply, e.g. ctrl+click adds/removes to/from current selection. The following operations can be applied on clusters: 1. Add/remove the selected objects to/from the cluster. 2. Delete cluster(s). 3. Select the objects in the selected cluster(s). 4. Remove all filtered objects from the selected cluster(s). 5. Save the cluster(s) into a file.
Objects can be filtered out using the buttons in the Filtering part of the control panel. A selection of objects can be removed from the visualisation panel and the list of objects in Selection by clicking the Filter out selected button. The Filter out non-selected button removes the objects that are not selected.
Clear filtereds button cancels the filter list, i.e., makes all objects visible again.
Filtering is an important iterative process for the analysis. Here are the steps of an example scenario: - filter objects 1 2 3, - filter objects 7 8 9, - undo last filtering, i.e., show object 7 8 9 again - clear the filtering, - filter objects 4 5 6. All of the steps are undoable, that is, the objects which were filtered will be re-shown and the selection of objects will be reset to those objects.
By default, VINeM creates neighborhood matrices of 1-dimensional projections for every dimension/attribute. It is possible create neighborhood matrices for any combination of dimensions. This is done by using the Distance measures panel. Select the type of distance measure and the dimensions you want to add, and then, click the Add button. Doing this adds it to a list which can be selected from using the combo box at the bottom.
The option that is selected in the combo box is your Selected Distance Measure. Neighborhood Matrix is shown for this measure. Note that, while the checkbox Sync with distance measure (in Dimension Order) is checked, the order and the distance will be in sync.
Order in the Neighborhood Matrix is important for visual analysis. Unfortunately, Dimension Order can only be used for univariate, i.e. 1-dimensional, distance measures. It is possible to use a partial sorting for the non-univariate distance measures. Right clicking on a column in Neighborhood Matrix selects the corresponding object as reference and sorts all of the objects according to their distances from that object. This is very useful to identify local clusters.
Two subspace clustering algorithms are provided in Mining panel:
Fast Miner finds the objects that form a cluster in multiple dimensions. It finds all of the clusters that are larger than the given size (Min-Length). It is very fast because it exploits the order in neighborhood database. As a trade-off it only works on the 1-dimensional neighborhood databases.Sampling Miner employs a Monte-Carlo process to find a sampling of all of the cluster structures. It takes minimum support and number of itemsets as parameters. It is provided for finding the clusters in non-univariate dimensions, while satisfying the interactivity time constraints. Its details are explained in this paper. The clusters that are found by the miners are added to the cluster list so that they can be further refined. Also, both of the miners can be run only on the selected objects by clicking the Mine Selected button.
Find related dims in Mining panel finds the related dimensions. It finds a fixed number of object sets of size 5 that frequently occur in the individual neighborhood databases. Supports of these object sets in other dimensions are calculated as the similarity score between the pairs of dimensions. More info about this calculation can be found in the paper.
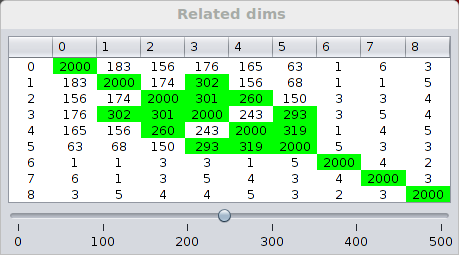
The scores of dimension pairs are presented as a matrix in a separate window. Higher scores indicate more similarity. At the bottom of the window, there is a slider for selecting a threshold. Values in the matrix that are greater than the threshold are highlighted in green.
Outliers can be identified as the objects that are not in the neighborhoods of many objects, hence having low support. An outlier miner Find Outliers is provided under the Mining panel. It identifies the outliers by finding the objects that has a low support than Min-Support in the selected measure or in each measure, as well as finding the ones that has a lower support globally. Outliers are added to Cluster List so that the user can inspect and decide what to do with them, e.g, filter them out.
Show Distribution shows the supports of the objects in the Neighborhood matrix.Save Matrix saves the Neighborhood Matrix as an image file.